Process Capability and performance (Pp, Ppk, Cp, Cpk) are specification indicators relative to process dispersion and process centering. Process capability is a statistical measurement of a process’s ability to produce parts within specified limits consistently. In other words, it is the ability of the process to meet the design specification for a service or a product.
Process capability is expressed as 6σ, where σ is the sample standard deviation of the process under a state of statistical control.
Don’t like Ads? Neither do I. If you’re a member, just log in to avoid ads. If you’re not a member, what are you waiting for? Sign up here!
Process capability refers to the inherent ability of a process to produce similar parts for a sustained time under a given set of conditions. A capable process is one where almost all the measurements fall inside the specification limit. In other words, a capable process is a process whose spread on the bell-shaped curve is narrower than the tolerance range.

Why use a process capability study
Process capability study helps in product and process design, vendor sourcing, production planning, and manufacturing process control.
A few ways a process capability study helps:
- Assists designers in selecting or designing processes
- Establishing an interval between sampling
- Specifying requirements of new equipment
- Vendor selection based on process capability
- Reducing variability in the manufacturing process
Short-term and long-term capability
Short-term capability is measured over a very short time period. In other words, it represents the variation at a certain time. For example, the process variation is relatively small in one shift with one piece of equipment. At the same time, long-term capability measures the variation over the duration of the entire study. If there is a shift in the process, the overall variation could exceed the subgroup variation.
In fact, control limits based on a short-term process evaluation are closer together than control limits based on the long-term process.

The basic interpretation is based on the underlying assumption of Six Sigma that a process will shift or drift ±1.5σ in the long term.
What are Process Capability Indices?
Cp, Pp, Cpk, and Ppk are capability and performance indicators for your process. Is a process capable? Is the process acceptable? How is the process actually behaving vs. how it theoretically could be behaving? You can ask these questions during a DMAIC project during both the Measure phase (if you have good, existing data) or the Control phase after implementing your changes.
Moreover, this article deals with an overall examination of Process Capability and performance (Pp, Ppk, Cp, Cpk).
If you’d like more depth, including calculations, etc., see these articles:
In fact, to begin to answer these questions, it all starts with customer requirements and the follow-up with what we know mathematically about the variation of the process.
Why Use Cp, Cpk, Pp, and Ppk?
Cp, Cpk, Pp, and Ppk are all parameters (indices) that can help us understand how our process operates relative to the specifications. In other words, they measure how close our process is running to its specification limits.
Don’t like Ads? Neither do I. If you’re a member, just log in to avoid ads. If you’re not a member, what are you waiting for? Sign up here!
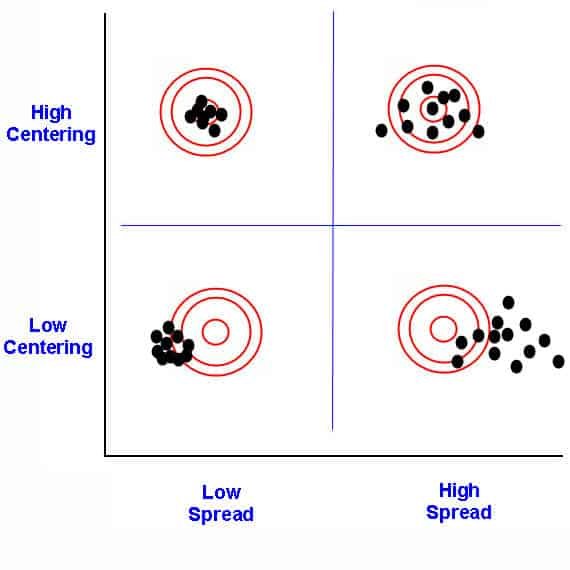
For requirements, we measure the process specifications. To determine the answers, we see how wide the process dispersion (spread of values) is and how centered the process is relative to those specifications.
Further on the mathematical side, we require the process to follow a normal distribution so we can take advantage of the properties there. Before using these indices to see how capable and acceptable your process is, test your process for normality. If it’s not normal, then see if you can apply a transform to get it there. If not, you may have to use non-normal distributions and methods (not part of the Six Sigma Black Belt curriculum. See the Master Black Belt guide.)
When to Use Process Capability Indices: Pp, Ppk, Cp, and Cpk
The main difference between Pp and Cp on one side and Ppk and Cpk on the other side is whether we use a complete set of data for calculation (Pp and Ppk), where we calculate the real performance of the system or if we use a sample (pre-production, batch, logical subgroups) where we calculate capability of the process. In the equation for Pp and Ppk, we use standard deviation based on studied data (whole population). In the equation for calculating Cp and Cpk, we use sample deviation or deviation mean within rational subgroups.

Differences Between Cp & Pp
The biggest difference between Cp and Pp is determining the Standard Deviation. For Pp, we use sampling and have to calculate an estimated standard deviation of the sample. In Cp, we assume a stable process and will likely have enough data to calculate a true standard deviation.
Attribute & Discrete Capability
Attribute capability refers to the ability of a process to produce products or services that meet binary or yes/no criteria. Examples of attribute data include pass/fail, good/bad, or acceptable/unacceptable.
Discrete capability refers to the ability of a process to produce products or services that meet discrete or countable criteria. Examples of discrete data include the number of defects per unit, the number of calls per day, or the number of products produced per hour. Measure the Discrete capability typically uses process capability indices, such as Cp or Cpk.
Both attribute and discrete capability are important for ensuring that a process meets customer requirements. The appropriate measurement technique will depend on the data type in the process.
Process Capability for Non-normal Data
In a real-time scenario, it is impossible always to fit the data into a normal distribution. If the histogram of the individual data element indicates that the data is not normally distributed, the procedure described above for determining the process capability indices does not yield the correct value for the percentage of process output exceeding the specifications.
The following are the options for better results:
Don’t like Ads? Neither do I. If you’re a member, just log in to avoid ads. If you’re not a member, what are you waiting for? Sign up here!
- Explore another known distribution that fits the data, such as exponential, chi-square, Weibull, and F distribution.
- Turn the continuous data into discrete data.
- Use non-linear regression to fit a curve to the data and apply numerical integration to find the area of the “tails” beyond the specification limits.
- Transform the data and specification limits. The Box-Cox and Johnson transformations are the most widely used among the data transform methods. These transformations introduce a new variable that will have a more normal distribution.
Process Capability for attributes data
The control chart represents the process capability once special causes have been identified and removed from the process. A capability is defined as the average proportion or rate of non-conforming products for attribute charts.
- p charts: Process capability is the process average nonconforming, p̅. Use 1- p̅ for proportion conforming to the specification.
- np charts: Process capability is the process average non-conforming p̅
- c charts: Process capability is the average number of nonconformities, c̅, in a sample of fixed size n.
- u charts: Process capability is the average number of nonconformities per reporting unit, u̅.
The average proportion of nonconforming may be reported on defects per million opportunities scale by multiplying times 1,000,000.
Binomial Capability Analysis
Binomial capability analysis determines whether the percentage of defective items meets customer requirements. It is a statistical method to evaluate the ability of a process to produce products or services that meet binary or yes/no criteria. The goal of binomial capability analysis is to determine if the process can produce products or services that meet the quality requirement with high confidence.
Don’t like Ads? Neither do I. If you’re a member, just log in to avoid ads. If you’re not a member, what are you waiting for? Sign up here!
Binomial capability analysis is used when the data is attribute data and classified as either conforming or non-conforming to a specific quality requirement. Furthermore, in binomial capability analysis, the process is characterized by a proportion, p, representing the probability that a unit will conform to the quality requirement.
Following steps to perform Binomial Capability Analysis:
- Collect data on the number of conforming and non-conforming units.
- Calculate the sample proportion, p̂. p̂ is the number of conforming units divided by the total number of units.
- Calculate the standard error of the sample proportion. √( p̂ x (1- p̂) / n), where n is the sample size.
- Calculate the upper and lower control limits for the process capability index, Cp, (USL – LSL) / (6σ).
- Calculate the process capability index, Cpk, which considers the process means deviation from the specification limits’ midpoint.
- Interpret the results to determine whether the process can confidently produce products or services that meet the quality requirement.
Process Capability studies
A process capability study helps to identify whether a process meets customer requirements consistently over a period of time. Furthermore, a process capability study yields a prediction; hence it needs to perform the study in a controlled and stable process environment.
Concept of Stability
Process stability is one of the critical factors in process capability, as an unstable process will produce products or services that are not consistent in quality. To achieve process stability, it is important to understand the sources of variation in the process and also to take appropriate steps to control them. Furthermore, achieving and maintaining process stability is an ongoing process that requires continuous monitoring and improvement.
There are several tools and techniques exist to assess process stability and control variation, including statistical process control (SPC), control charts, and process capability analysis. These tools help to identify when a process is out of control or producing products or services outside of the desired range of variability.
Verifying Stability and Normality
If a process variation is due to a common cause, the output distribution forms a relatively stable one because the variation is constant. However, if a special cause exists in a process, the output distribution is unstable and predictable, leading to inaccurate results. If the variation is due to a common cause, the output will still form a distribution that is relatively stable as the variation is constant. However, if the variation is a result of a special cause, then the output is not as stable and not as predictable. In this case, a process capability study may have problems with its accuracy.
Process Capability Study Procedure
Here is the general procedure for conducting a process capability study:
- Select a process to study, including process inputs, outputs, and key parameters. Use Pareto or cause-and-effect diagram-related techniques to identify the process to study.
- Perform measurement systems analysis to ensure the measurement system produces accurate data.
- Collect data using a sampling plan that is representative of the process. Make sure there is sufficient sample size and sampling frequency to provide a statistically valid analysis.
- Select appropriate process capability analysis methods like Cp, Cpk, Pp, and Ppk.
- Develop an estimate of process capability. Then, compare it with specification limits to check whether the process can meet customer requirements.
- If the process does not meet the customer’s requirements, identify the root cause and initiate appropriate corrective actions to address the variation.
- Validate the effectiveness of the corrective action and monitor the process periodically.
Don’t like Ads? Neither do I. If you’re a member, just log in to avoid ads. If you’re not a member, what are you waiting for? Sign up here!
Identifying Characteristics
The selection of important characteristics is one of the crucial steps in process capability study. The characteristics should meet specific requirements such as:
- The characteristics are outcomes of a process. If the Y changes, the Inputs or Xs change. Hence
- Flexible to adjust the characteristics values
- Able to maintain and control the influential operating parameters
- Select the characteristic which significantly impacts the quality of the product or process. For example, a process may contain 20 to 30 parameters. Still, in reality, only 3 or 4 may greatly impact the process and include only those parameters in the process capability study.
- Often characteristics are selected based on past history that is difficult to monitor and control.
Identifying Specifications/Tolerances
Specification limits are the targets set for a product or the process by customer or market performance; often, the Voice of the Customer is the input for these criteria. In other words, it is the intended result of the metric that we measure.
Customers set the limit (upper and lower) on the product characteristics that define where the product works and where it does not. If the product falls outside of these limits, assume that the customer will reject the product. Specification limits are related to product design. Hence, set these limits in the design phase of the product life cycle.

Upper Specification Limit: The highest limit a customer would accept.
Example: A customer would wait in line at a drive-through for 7 minutes before being dissatisfied.
Lower Specification Limit: The lowest limit a customer would accept.
Example: A customer would expect no less than 100 M&Ms to be in a packet before being dissatisfied.
Monitoring techniques
Monitoring techniques for process capability include keeping track of the performance of a process over time to ensure that it is operating within its specified limits and producing the output that meets customer requirements. A few monitoring techniques are:
Don’t like Ads? Neither do I. If you’re a member, just log in to avoid ads. If you’re not a member, what are you waiting for? Sign up here!
- Statistical process control (SPC: Statistical Process Control (SPC) is a statistical method to measure, monitor, and control a process. It is a scientific visual method to monitor, control, and improve the process by eliminating special cause variations in a process.
- Control charts: Control charts are graphical tools used to monitor a process over time. A control chart is one of the primary techniques of statistical process control (SPC). The control chart is a graphical display of quality characteristics that have been measured or computed from a sample versus the sample number or time.
- Process capability indices: Process capability indices are numerical measures of the ability of a process to produce products or services within a specified range of variability. These indices can be used to monitor process performance and identify areas for improvement.
- Failure mode and effects analysis (FMEA): FMEA is a technique to identify and evaluate potential failures in a process. And also to determine the potential effects of those failures on the final product or service. FMEA is a tool that helps us anticipate what might go wrong with a product or process. We can also use it to identify the possible causes and probabilities of failures.
What Can Process Capability and Process Performance Tell Us?
Process Capability Analysis tells us how well a process meets a set of specification limits based on a sample of data taken from a process. It can be used to establish a baseline for the process and measure the future state performance of the process for comparison.
Cp for processes that are under statistical control and Pp for new processes. A good analogy is parking a car in a garage. If the car is bigger than the garage, it will not fit within the specification limits and thus is incapable– this case is clear.
What about a case when our car is skinnier than the garage you’re trying to park it in (the specification width)? Can we consider our parking process a capable one? It depends on our specifications and the width of the car. Are we satisfied with the probability of 99% that we will park our car without hitting the wall? This means that one in a hundred attempts to park our car will hit the garage wall!
Different Methods to Calculate Process Capability
One way to calculate Process Capability is through the number of defects per opportunity. This is usually used for discrete data and in manufacturing. Usually, an acceptable number of 3.4 Defects Per Million Opportunities (DPMO).

The other way to calculate Process Capability is through the use of a statistical methodology. Processes with a normal distribution of data have restrictions from one or both sides of the curve based on the Specification Limits (USL and LSL):

Shaded areas represent the probability of defects; our goal is to minimize the size of the shaded areas.
Is a Process Capable?
Process capability analysis is the act of determining if a process can meet specifications.
Here we want to use Pp for new processes or Cp for processes that are under statistical control. A good analogy is parking a car in a garage. A capable process indicates the car (process) is skinnier than the garage you’re trying to park it in (the specification width). If the car is much bigger than the garage, it is not enough to be capable of fitting within the specification limits and thus is not capable.
Is the Process Acceptable?
A capable process does not necessarily mean it is acceptable. Using the garage example, the car may have crashed into the side or may have missed it completely. This point reflects how centered a process is. We can measure this using Ppk or Cpk.
Also, see more about Cpk. and Ppk.
A Note on a Process Being Both Capable and Acceptable
A process is said to be capable and acceptable when it meets customer requirements. Specifically, having zero defects is usually unrealistic and not usually a part of customer requirements. A process could be capable but unacceptable because it is poorly centered and ends up outside the spec limits. For example, a car could fit in the garage, but the process of parking it could have it just as easily end up driving through your front door as it could safely parked!
Six Sigma Process Capability & Performance Limits
Don’t like Ads? Neither do I. If you’re a member, just log in to avoid ads. If you’re not a member, what are you waiting for? Sign up here!
According to Six Sigma philosophy, Cp or Pp and Cpk or Ppk should be greater than 1.50. Six Sigma deems a process acceptable only after achieving a maximum defect rate of 3.4 ppm opportunities. Furthermore, there is a direct correlation between Cpk or Ppk and parts per million defects. Because only Cps or Pps and Cpks or Ppks that are greater than 1.50 are achieving this goal (3.4 Defects per million).
Control Limits, Specification Limits, and Process Capability
Pp vs. Cp (Capability Indices)
In fact, both Cp and Pp monitor indices for the spread of your process compared to the specification spread. However, use Cp when a process is under statistical control and Pp when a process is initially starting out.
Uses for Cp & Pp
- Used to see if a process is capable.
- Neither is concerned with centering. Cp or Pp takes into account dispersion, NOT centering. Since Cp does not consider process centering, it cannot be used to determine whether a process is acceptable.
- Cpk & Ppk both take centering into account, so use them to see if a process is acceptable.
- In addition, both Cp & Pp are NOT concerned with the control of a process. The term “control” infers an element of time, and Cp or Pp is merely a snapshot of the process variation at a given point in time.
- For example, a Cp of < 1 does NOT indicate a process is out of control. “Control” is controlling variation over a period of time. A Cp is a snapshot at a point in time but does not indicate that the process is in control.
- Both indices are larger-is-better quality characteristics.
- It can never be 0.
- If Cp or Pp >1, Tolerance is > spread; the Process has the potential to be capable (depending on centering).
- A CP of >1 doesn’t mean quality. One could have a Cp of 400 and produce 100% defects because the process was not centered within the specification limits.
- If Cp or Pp <1 process spread is > tolerance, the variation will never fit, and the process will never be capable.
- A Cp of < 1 does NOT indicate a process is out of control. “Control” is controlling variation over a period of time.
- If 0< CP <1, then the specifications are that percentage of the process.
- Ex. Cp 0.70 = 70%. A Cp of 0.70 means the specifications are 70% of the process.
Ppk vs. Cpk (Acceptable Performance)
Cpk and Ppk are ways to measure the capability of a process because they are monitoring indices for process centering.
Uses for Cp & Pp: Is The Process Acceptable?
Don’t like Ads? Neither do I. If you’re a member, just log in to avoid ads. If you’re not a member, what are you waiting for? Sign up here!
Cpk or Ppk considers centering, and thus it helps to determine if a process is acceptable.
- Ways to measure the capability of a process.
- Reflect on the actual performance of the process.
- Both Cpk and Ppk can be negative numbers. So, it means that, on average, the process is not meeting customer requirements.
Can Cpk or Ppk be Negative? What does a negative Cpk or Ppk Indicate?
Yes, it is possible for Cpk and Ppk to be negative. Let’s look at the equation. For simplicity, we will use the Ppk.
Ppk = [ USL – x(bar) ] / 3 s
Moreover, it is impossible to have a standard deviation be negative, so that would mean that x(bar) was larger than the Specification Limit. In other words, the process average is out of specification.
This could indicate that the process mean has drifted over either the upper specification or the lower one. This is not good because it means that the process is not meeting customer requirements.
Pp, Ppk vs. Cp, CPK
- Cp & Cpk use an estimate for the standard deviation using the R Bar / d2 method.
- Pp and Ppk are more liberal, whereas Cp and CPK are more conservative.
- Use Pp & Ppk when you are initially setting up your process.
- Use Cp & Cpk once the process is in a state of statistical control.
- Cpk or Ppk is less than CP or Pp.
Interesting video on assessing Ppk and Cpk in Minitab.
Additional notes for Cp, Cpk, Pp, Ppk
Concept of Stability
- Also, see http://www.qimacros.com/lean-six-sigma-articles/stability-analysis-vs-capability-analysis/
Attribute & Discrete Capability
Monitoring Techniques
- Also, see Statistical Process Control
DPMO with Sigma Shift Table

When you’re ready, there are a few ways I can help:
First, join 30,000+ other Six Sigma professionals by subscribing to my email newsletter. A short read every Monday to start your work week off correctly. Always free.
—
If you’re looking to pass your Six Sigma Green Belt or Black Belt exams, I’d recommend starting with my affordable study guide:
1)→ 🟢Pass Your Six Sigma Green Belt
2)→ ⚫Pass Your Six Sigma Black Belt
You’ve spent so much effort learning Lean Six Sigma. Why leave passing your certification exam up to chance? This comprehensive study guide offers 1,000+ exam-like questions for Green Belts (2,000+ for Black Belts) with full answer walkthroughs, access to instructors, detailed study material, and more.